Understand your disease patterns through documentation and visualization
Inflammatory bowel disease is complex. Your symptoms may fluctuate, medications change, and your disease activity can shift unexpectedly. In the midst of these challenges, it's easy to forget how you felt six months ago or to miss subtle patterns that emerge over time.
Visualization transforms fragmented experiences into a coherent narrative.1 When you visualize your IBD journey, you gain the ability to spot trends and patterns that might otherwise go unnoticed. You might notice that your flares tend to occur during stressful periods ("Huh...I always flare around the holidays...why is that?"). These insights are invaluable for working with your healthcare team and making informed decisions about your care.
Your timeline doesn't need to be elaborate or artistic to be helpful—it simply needs to capture information that could useful in tracking your disease patterns. Start by recording significant milestones: when you were diagnosed, when you started each medication, and when you experienced major flares. Include notes about symptom severity, hospitalizations, and surgical procedures if applicable.
Many patients find it helpful to use a simple spreadsheet with columns for date, symptoms, medications, stressors, diet notes, and overall disease activity. Others prefer a notebook, with entries that tell the story of their journey in their own words. Some use digital tools like health tracking apps.
The method matters less than the consistency. Over time, your timeline becomes an invaluable resource for understanding your disease, predicting flares, and demonstrating patterns to your care team.
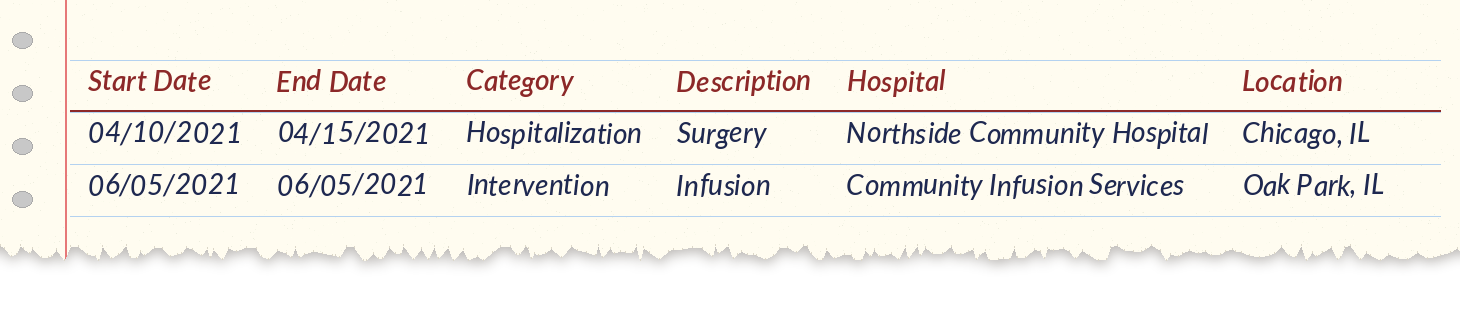
Upload a spreadsheet containing your medical history (flares, hospitalizations, interventions, surgeries) to instantly generate an interactive, year-over-year timeline. Each row represents a new medical event (ie: hospitalization) displayed as a colored bar or an ongoing intervention such as an ileostomy or TPN (displayed as a shaded background region). Your data stays entirely in your browser — nothing is sent to a server. Once generated, you'll receive a shareable URL that encodes your timeline so you can revisit it anytime.
Example hospitalization and intervention history
Your personal timeline and visualizations are powerful tools for communication with your gastroenterologist and other healthcare providers. Rather than relying on memory during appointments, you can bring concrete documentation of your disease activity, medication responses, and symptoms. This transforms the conversation from "How have you been doing?" to a data-informed discussion supported by specific examples.
When you arrive at appointments with your timeline, you're demonstrating engaged self-advocacy and providing your doctor with the comprehensive picture they need to make informed recommendations. You can discuss why you felt a particular medication wasn't working, show patterns of flare timing, and articulate how your disease is affecting your quality of life. This collaborative approach—where you bring organized information and your doctor brings medical expertise—leads to better treatment decisions. Your visualization becomes a conversation guide, ensuring that nothing important gets overlooked and that your healthcare team can tailor their approach specifically to your IBD journey.
This information is educational and should not replace professional medical advice. Always consult with your healthcare provider before making any changes to your treatment plan.